Responder analysis: identifying responders in clinical trials
Posted on 8th July 2019 by Giorgio Karam
Introduction
What is the best way to report the outcomes of parallel-arm trials which focus on continuous variables, like pain or depression symptoms? One way is to report the mean difference between the two groups (e.g., final pain score of 5 in drug arm vs. 6 in placebo arm). Another way is to report the percentage of patients in each arm who had, for example, 50% reduction in symptoms. The latter is known as ‘responder analysis’ (1), implying that it identifies the percentage of patients who ‘respond’ to the treatment.
Intuitively, it is an appealing approach since, in practice, patients seem to differ in their response to treatments: some improve greatly after starting a new therapy, others do not change at all, and still others worsen. The mean difference, so it seems, averages these into one number, telling us little about how it will affect an individual patient. Responder analysis, on the other hand, seemingly tells us the chances that a drug will help a patient achieve a clinically important benefit, a much more helpful measure. However, further thinking reveals the limitations to this and the importance of knowing the mean difference.
Illustrating the limitations
It would be a mistake to assume that parallel-arm trials can tell us which individuals respond to a drug, since we do not know how a given individual would have done if left untreated. Notably, a considerable number of patients improve substantially even on placebo. Consider that some of these placebo-treated patients will improve, but are just under the cut-off to be classified as responders. These patients, if they were to take a drug which improved their outcome by a very small (even clinically insignificant) amount, would then be budged slightly past this cut-off and be classified as responders.
This phenomenon has been observed in how statins, which cause a very small increase in HbA1c, give patients a small increased risk in being diagnosed with diabetes (defined as HbA1c 6.5%). Are statins causing large increases in blood sugar in a select group of patients? No. More likely they are just shifting borderline cases where patients already had a HbA1c very close to the diabetes cut-off. In the same way, ‘responder analysis’ is at risk of primarily identifying borderline cases for whom even a marginal response to the treatment is pushing them past the cut-off, and not patients who are receiving an exceptional benefit to the treatment.
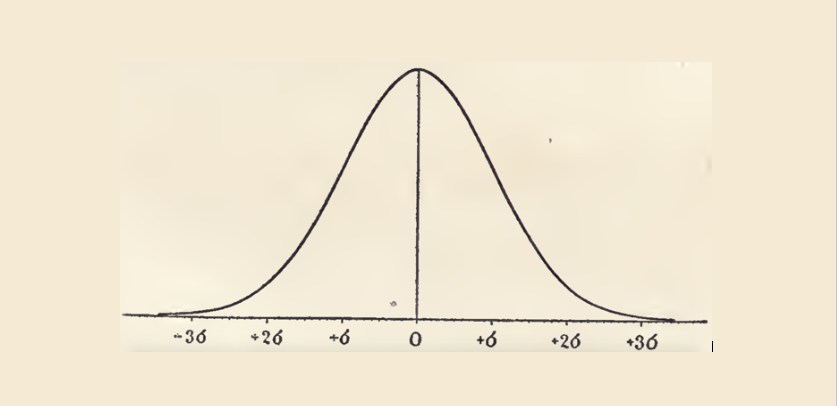
To illustrate, a Cochrane Review of acetaminophen for osteoarthritis found that, on average, it reduced pain by 4 mm on a visual analog scale (VAS) of 0 to 100 mm, which is not clinically significant. However, it also reported a number needed to treat (NNT) of 16 for “pain response.” Although the definition of response is not mentioned, a common dichotomized value to identify responders is 50% pain relief. In the largest trial included, baseline pain was roughly 70 mm, so 50% pain relief would equal pain reduction corresponding to 35 mm. Patients improved 15 mm on placebo (standard deviation 21 mm). If we treat this as normal distribution (a common assumption in pain trials), we can calculate that about 5% improved between 31 and 35 mm on placebo. If these people were to take acetaminophen and do 4 mm better, then they would have 35 mm pain reduction and so be classified as “responders” by the analysis. The NNT here would be 20, similar to the value reported by the Cochrane authors.
Discussion
From this, it should be clear that clinical trials generally cannot identify the response an individual is experiencing. Nevertheless, there are some benefits to responder analysis. Firstly, continuous analysis will struggle to assign a value (e.g., pain symptoms) to dropouts in trials, whereas in responder analysis they can be reasonably classified as non-responders. Also, it is helpful for clinicians and patients to know that a certain percentage do achieve substantial symptom relief, even if not all this improvement is attributable to the studied treatment. For these purposes, the best method is one recommended by IMMPACT for pain (Initiative on Methods, Measurement, and Pain Assessment in Clinical Trials), in which a cumulative chart shows the proportion achieving symptom relief at each possible cut-off.
Is there a way to identify an individual’s response to a treatment? The most rigorous way is an n-of-1 trial, in which a patient receives a treatment or a control at different times assigned randomly. A 2009 meta-analysis of such trials comparing gabapentin and placebo for neuropathic pain reported a similar mean difference (0.8 difference on a 10-point pain scale) as a meta-analysis of parallel-arm trials (0.78 point difference). It did record, however, that pain scores were “definitely better” on gabapentin in 10 of 55 patients, compared to “definitely better” on placebo in 1 of 55. So there is evidence behind the common clinical assumption that patients respond differently to drugs. But, to maintain rigor, it should be this method – n-of-1 trials – and not responder analysis to establish the frequency of responders.