EBM at the bedside: post-test probabilities using the Fagan nomogram
Posted on 3rd March 2015 by Iván Murrieta Álvarez

One very important step in the assessment of a patient is the decision of what diagnostic test should be used in determining a patient’s needs. In most cases, that decision is based on the physician’s experience and knowledge. However, sometimes it is difficult to decide which test is the best for a patient in terms of costs, accuracy, reliability, safety, and efficacy. In this case, there are some simple methods the physician can use to obtain some evidence to support his decision-making.
Likelihood ratios
One way to interpret and analyze a diagnostic test is by using likelihood ratios (LR), which are basically a ratio of the probability that a result is correct to the probability that the result is incorrect. LRs are generated from the sensitivity and specificity of a given test as we can see:
- Positive likelihood ratio = sensitivity/1-specificity
- Negative likelihood ratio = 1-sensitivity/specificity
Likelihood ratios have a number of useful characteristics:
- They do not vary in different populations or groups of patients because they are based on a ratio of sensitivity and specificity;
- They can be useful directly at the individual patient level;
- They allow the clinician to quantitate the probability of a disease for any individual patient.
The interpretation of likelihood ratios is intuitive: the larger the positive likelihood ratio, the greater the likelihood of disease; the smaller the negative likelihood ratio, the lesser the likelihood of disease.
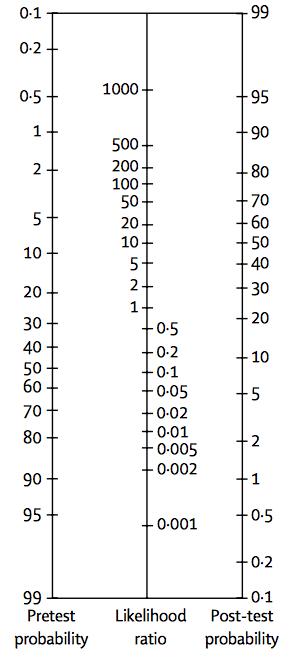
Fig. 1 The nomogram showing Bayes’ Theorem, produced by Dr Terrence J. Fagan in 1975, is a useful paper-only tool in the practice of evidence-based medicine.
To illustrate how likelihood ratios work, let me take the example of a 50-year-old male with a positive stress test (exam used in patients with suspected coronary artery disease). It is known that a more than 1 mm depression of the ST segment on the electrocardiogram during the exercise stress testing has a sensitivity and specificity of 65% and 89% respectively for coronary artery disease. This means that:
- Positive likelihood ratio = 0.65/(1-0.89) = 5.9
- Negative likelihood ratio = (1-0.65)/0.89 = 0.3
The likelihood of this patient having a disease has increased by approximately six-fold given the positive test result. So, in order to translate this into a probability of a disease one must use Bayes’ Theorem. But wait, you may ask, what is Bayes’ Theorem?
Bayes’ Theorem
The Bayes’ Theorem is a theorem of probability, and it can be seen as a way of understanding how the probability that a theory is true is affected by a new piece of evidence. Therefore, in this context the Bayes’ Theorem states that the pre-test odds of disease multiplied by the likelihood ratio yields the post-test odds of disease. And because of the theorem’s mathematical characteristics, the likelihood ratios must be used with odds rather than per cent probability of disease.
In order to avoid converting fractions to odds, multiplying by the odds ratio, getting the post-test odds and converting back to a fraction, the Fagan nomogram is used. This nomogram is designed in three parallel longitudinal axes: left, centre and right. The left axis represents the pre-test probability and is joined to the likelihood ratio, on the central axis, to read off the post-test probability on the third axis. To use it, you simply draw a line from the known pre-test probability, through either the LR+ (for a positive diagnostic test result) or the LR- (for a negative diagnostic test result) and read off the post-test probability. Nowadays, there are more “modern” alternatives like the Two-Step Fagan Nomogram, which adds two extra axis between the LR axis that represents sensibility and specificity to calculate negative and positive likelihood ratios in the same nomogram.
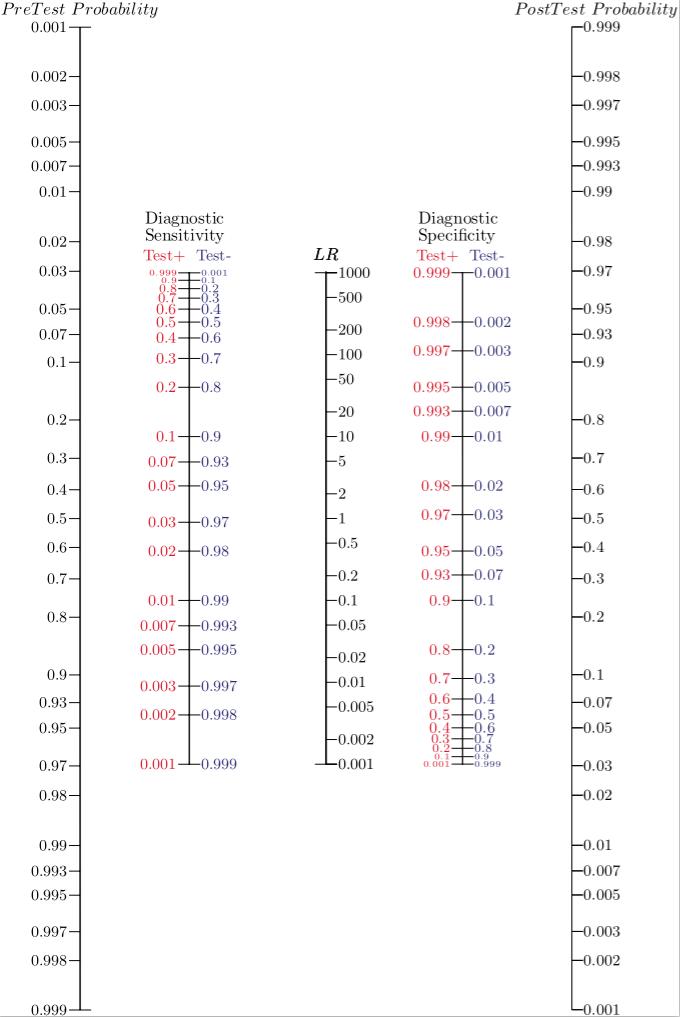
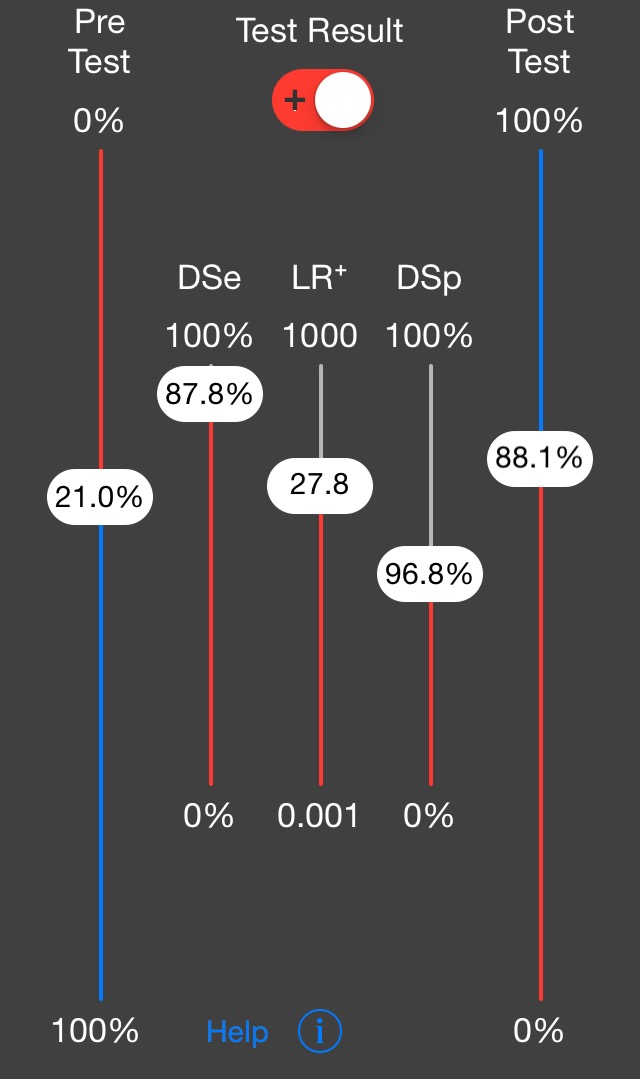
Fig 2. The two-step Fagan nomogram takes a step back, incorporating lines for test sensitivity and specificty, which are used to directly determine the Likelihood Ratios. These figures are often more widely known than the LRs derived from them. Fig.3 The two-step nomogram is also available as a smartphone app.
If the Likelihood Ratio is equal to 1, then the pre- and post-test probabilities are the same- the diagnostic test is not helpful. If LR+ (for positive results) is greater than 1, the post-test probability of the disease being present increases. If the LR- (for negative results) is smaller than 1, then the post-test probability of the disease being present decreases. In both cases, the diagnostic test has refined the probability that the patient has or does not have the disease being tested for.
How are pre-test probabilities calculated?
Obtaining the pre-test probability is the first step of this method. But how is it estimated? To answer this question I would like to address an example: the Wells’ Score for Pulmonary Embolism and Deep Venous Thrombosis. This score is an evidence-based tool which calculates the pre-test probability for pulmonary embolism and deep venous thrombosis using clinical data obtained during the primary examination, just prior to performing a confirmatory test.
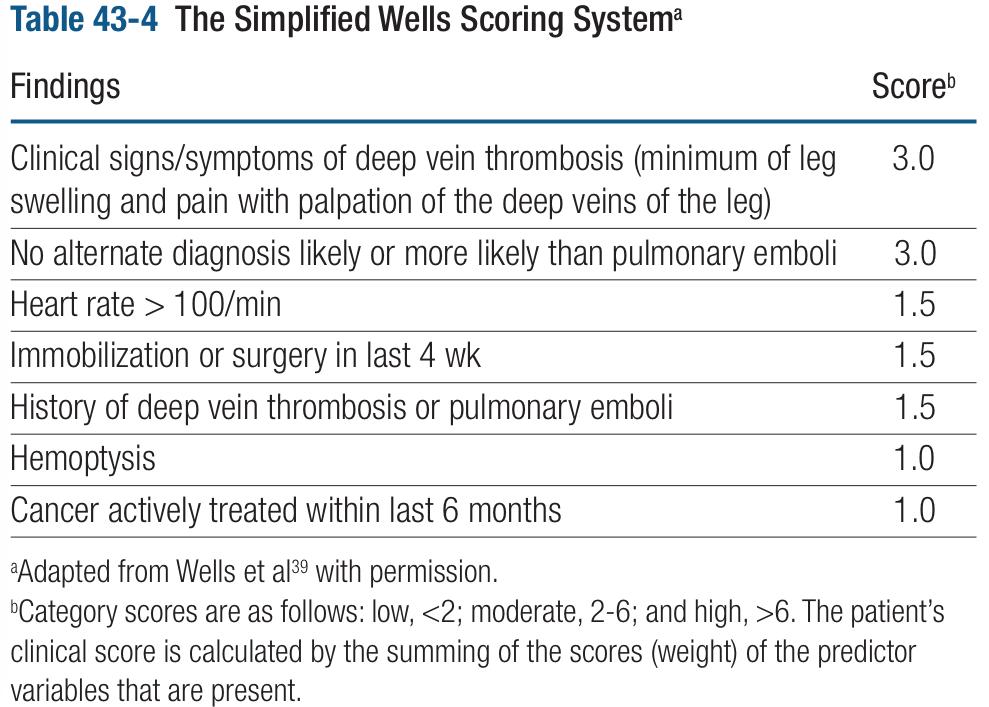
Fig. 4 A tool for working out the pre-test probability of a patient having pulmonary embolism and deep venous thrombosis.
As you can see in the image, this tool is composed of seven criteria with scores that range from 1.0 to 3.0, if a sum of all the positive findings in a certain patient is done, the result will categorize the patient in a level of risk: low, moderate and high probability. According to some studies that have validated the Wells’ Score to rule in and out pulmonary embolism, the low risk group has a “prevalence” of 1-2%. What it means is that in a group of patients that have 1 point, there is a risk of 1-2 of having a pulmonary embolism. In other words, every group of risk has different odds according to the number of patients who have the disease within every group of risk, just like a prevalence for every category of risk. Therefore, for this case we will use the first study data that validated this score, which indicates that a patient with low risk characteristics (< 2 points) has a 1.3 of risk for PE. In moderate risk patient (2-6 points) the odds of PE are 16.2 and for the group of high risk (>6 points) the possibilities of having PE are 40. Note that these numbers can be used as percentages because, viewed from another perspective, they indicate the prevalence of pulmonary embolism in every risk group .
Unfortunately, nowadays, there are just a few scores and tools to calculate pre-test probabilities of common clinical problems, for example, the Alvarado score for appendicitis, TIMI risk score for ischemic heart events, or the 4T’s score used to assess the Heparin-induced thrombocytopenia. Therefore, in the absence of a broad existence of evidence-based tools for determining the pre-test probability of many diseases, clinicians may end up making an estimate based on their existing knowledge and observations.
And, what about the post-test probabilities?
When post-test probabilities are calculated the decision-making is driven by a quantitative method, an almost “pure” scientific tool, determined by the sum of new information and the original data that is acquired from the patient. In one way, this method will confirm the diagnosis and will give the physician a good standpoint from which to start the indicated treatment.
In another way, post-test probabilities support the physician in such a manner that the doctor can discriminate which test is best for the patient, in terms of costs and safety by using the most economical and safest option by which an acceptable post-test probability can be achieved.
Explained in another way, imagine if someone had the opportunity to drive an F1 car to work three blocks away from their home, each close enough to be visible from the other. Sure, the F1 car is cool and noisy, but the distance is so close that the result will be almost the same if you use a bicycle, and most importantly, lots of money will be saved!
Something similar happens regarding safety, if you could go to work in an F1 car, you would need a special suit, a helmet, and a whole team, because of the risks involved, like crashing with another vehicle or against a wall, or maybe a fire inside the cockpit. On the contrary, the bicycle doesn’t even have an engine!
In the case of medicine, a radiography or CT with contrast medium is more expensive and carries a higher risk for the patient than an ultrasound for example. The need of a test should rely on the expected results; will the test result will be strong enough if a cheaper test is used? Is it possible to achieve a good probability to diagnose a disease with the safer test available? Do not forget that the most important issue is the patient.
Integrating concepts
In order to elucidate this method in a simple manner we will review this example in an emergency department setting: consider a 62-year-old female who attends the hospital complaining about “chest pain”, “problems with breathing” and “blood in the expectoration”.
After conducting a primary examination the physician suspects an episode of pulmonary embolism (PE). Hence, to determine the diagnostic approach the Wells’ Score is calculated. The results of the score are 6.5 because at the admission to the ER the patient had a heart rate of 110 beats per minute and was coughing up blood (hemoptysis). The patient’s symptoms are consistent with the classical symptoms of deep vein thrombosis and she mentions that she has been undergoing therapy for colon cancer for the past 2 months. Therefore, the odds of this patient having PE is around 40.
According to the score this is a high risk patient, so the recommended diagnostic test is oriented to confirm the suspected PE. In this case one of the best options is the computed tomography angiography (CTA), because it is a well validated test to confirm PE cases and is widely available at most hospitals. According to a study conducted on 7,248 patients with suspected PE, the CTA showed a sensitivity and specificity of 83% and 96% respectively. Having in mind the sensitivity and specificity of CTA the LR+ will be 20.75 (LR+ = 0.83/1-0.96) and LR- 0.17 (LR- = 1-0.83/0.96).
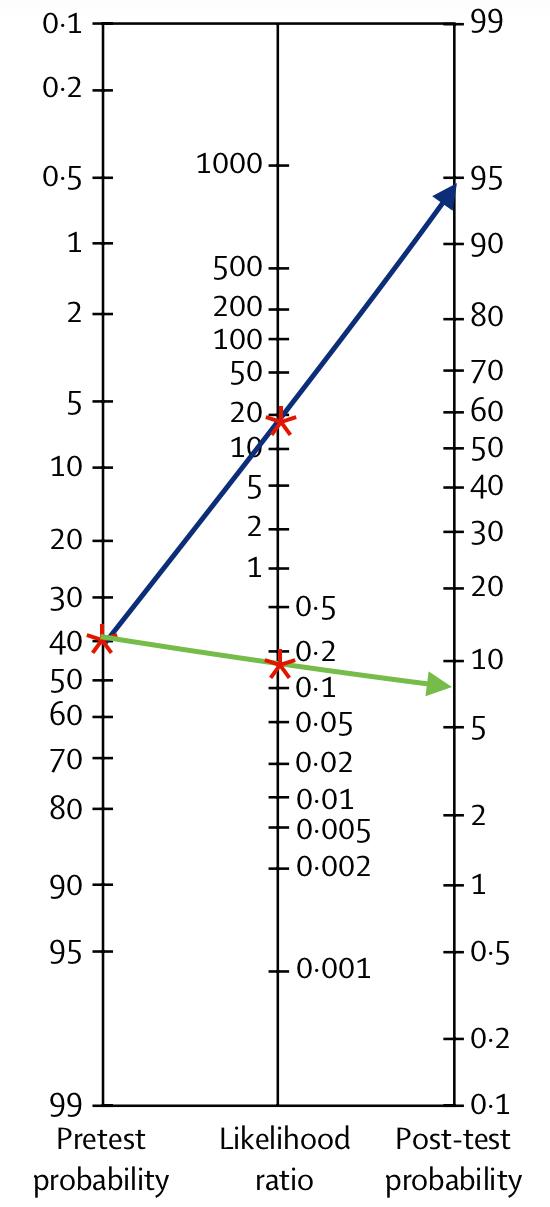
Fig. 5 The completed nomogram showing post-test probabilities for a positive and negative diagnostic test result.
Finally, after the result of the CTA is available, we can read off the post-test probability, which is around 93% if the CTA is positive and between 5 and 10% if it is negative, as you can see in fig.5.
Conclusion
The Fagan Nomogram – especially the two-step nomogram for instances in which the LR is not yet known – is a great example of putting evidence-based tools to use at the bedside. Since the pre-test probability is a natural and intuitive number to consider in assessing a patient, it is amazing to consider what can be done with two further straight lines drawn without the aid of a computer. The result can often be a much more refined understanding of the meaningfulness and utility of a test, and better support in determining a patient’s care pathway.
Going Further
If you are interested in learning more about this EBM approach, these are some useful resources:
- Diagnostics and Likelihood Ratios, Explained by the NNT: http://www.thennt.com/diagnostics-and-likelihood-ratios-explained/
- Bayesian Approach to Clinical Decision Making by Alejandro Baez MD (podcast audio): https://vimeo.com/111380685
- Joe Marasco. Bayes, Medical Diagnostics, and Nomograms. Stanford University: http://youtu.be/7VTQ1glcXYg
- Grimmes DA, Schulz KF. Refining clinical diagnosis with likelihood ratios. Lancet 2005; 365: 1500-1505
- Attia J. Moving beyond sensitivity and specificity: using likelihood ratios to interpret diagnostic tests. Aust Prescr 2003; 26: 111-113
- Fagan TJ. Letter: nomogram for Bayes theorem. N Engl J Med 1975; 293: 253
- Glasziou P. Which methods for bedside Bayes? Evid Based Med 2001; 6: 164-166
- Simmel DL, Rennie D. The rational clinical examination: evidence based clinical diagnosis. McGraw-Hill; 2009
- Caraguel C, Vanderstichel R. The two-step Fagan’s nomogram: ad hoc interpretation of a diagnostic test result without calculation. Evid Based Med 2013; 18: 125-128
- DocNomo app: agraphical tool to calculate LRs and post-test probability using sensibility and specificity for iOS devices, https://itunes.apple.com/us/app/docnomo/id901279945?mt=8
Acknowledgments
Thank you to Robbie Dawson and Holly Millward at Cochrane UK for their orientation and support.


No Comments on EBM at the bedside: post-test probabilities using the Fagan nomogram
Comment made from Dr Yaolin Zhou:
I love this example, but I am not sure that figure 5 is sized properly.
The post states that the probability of a pulmonary embolism in the setting of a negative CTA is “between 5 and 10% if it is negative.”
The probability of PE with a negative test represents
False Negatives / (False Negatives + True negatives)
With the prevalence of 40.6% used in your example, 83% sensitivity, and 96% specificity, in a population of 1000 people, there would be 69 FN and 570 TN.
False Negatives / (False Negatives + True negatives) = 69/639 = 10.8%
30th November 2017 at 3:08 pmLook at the nomogram for p values by L Held
4th December 2016 at 12:25 amThe intuitive concept of a LR is this. Suppose a LR in 4 for a positive test in diagnosing a disease.
This means that it is 4 times as likely to get a positive test when you do have the disease, compared to when you don’t have the disease
9th April 2016 at 8:12 pmVery useful, thank you for the share!
9th March 2015 at 4:45 pm