QMP Medical Statistics Tutorials: Summarising Data
Posted on 8th April 2013 by HollyMillward
Information needs to be analysed effectively for it to be meaningful or useful. Summarising data effectively is a skill central to the world of evidence-based medicine. In this medical statistics tutorial we will be looking at how the data that are collected by studies are summarized and presented in order to extract useful information. We will then start to look at how to analyse the data.
Summarising Data:
- Types of data
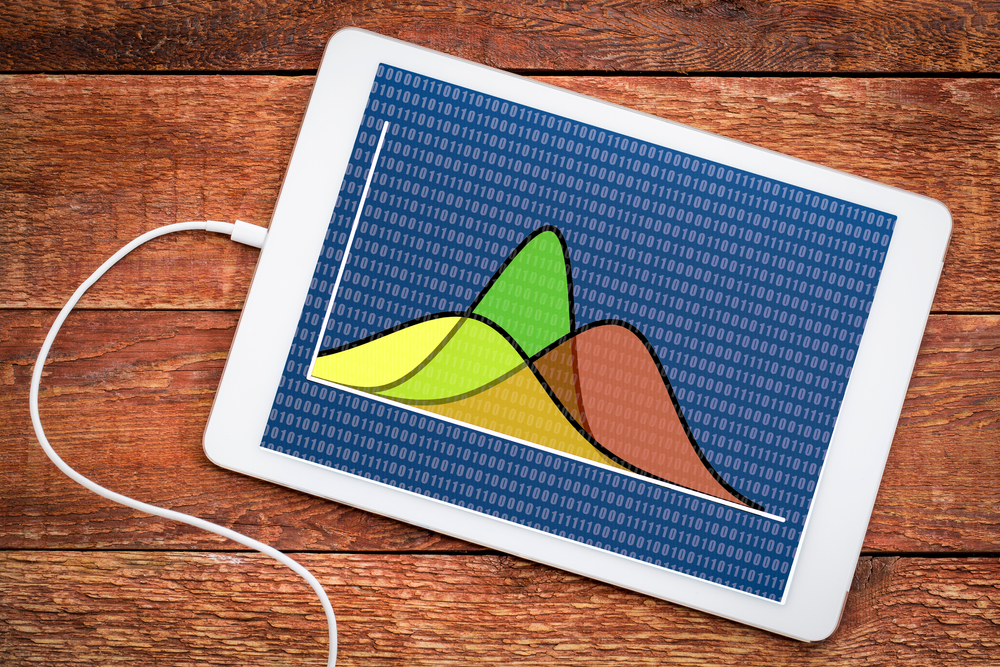
- Frequency distribution, shapes
- Histograms
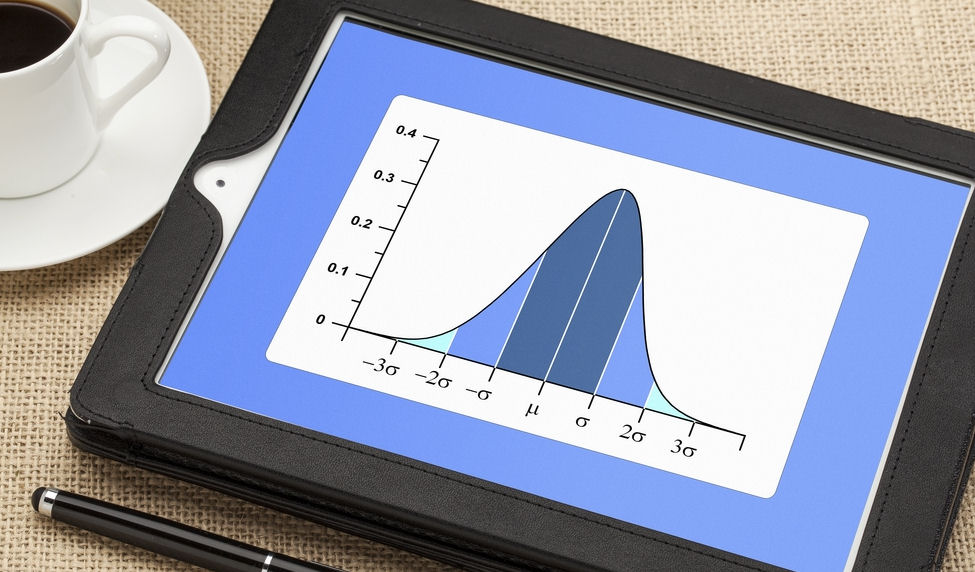
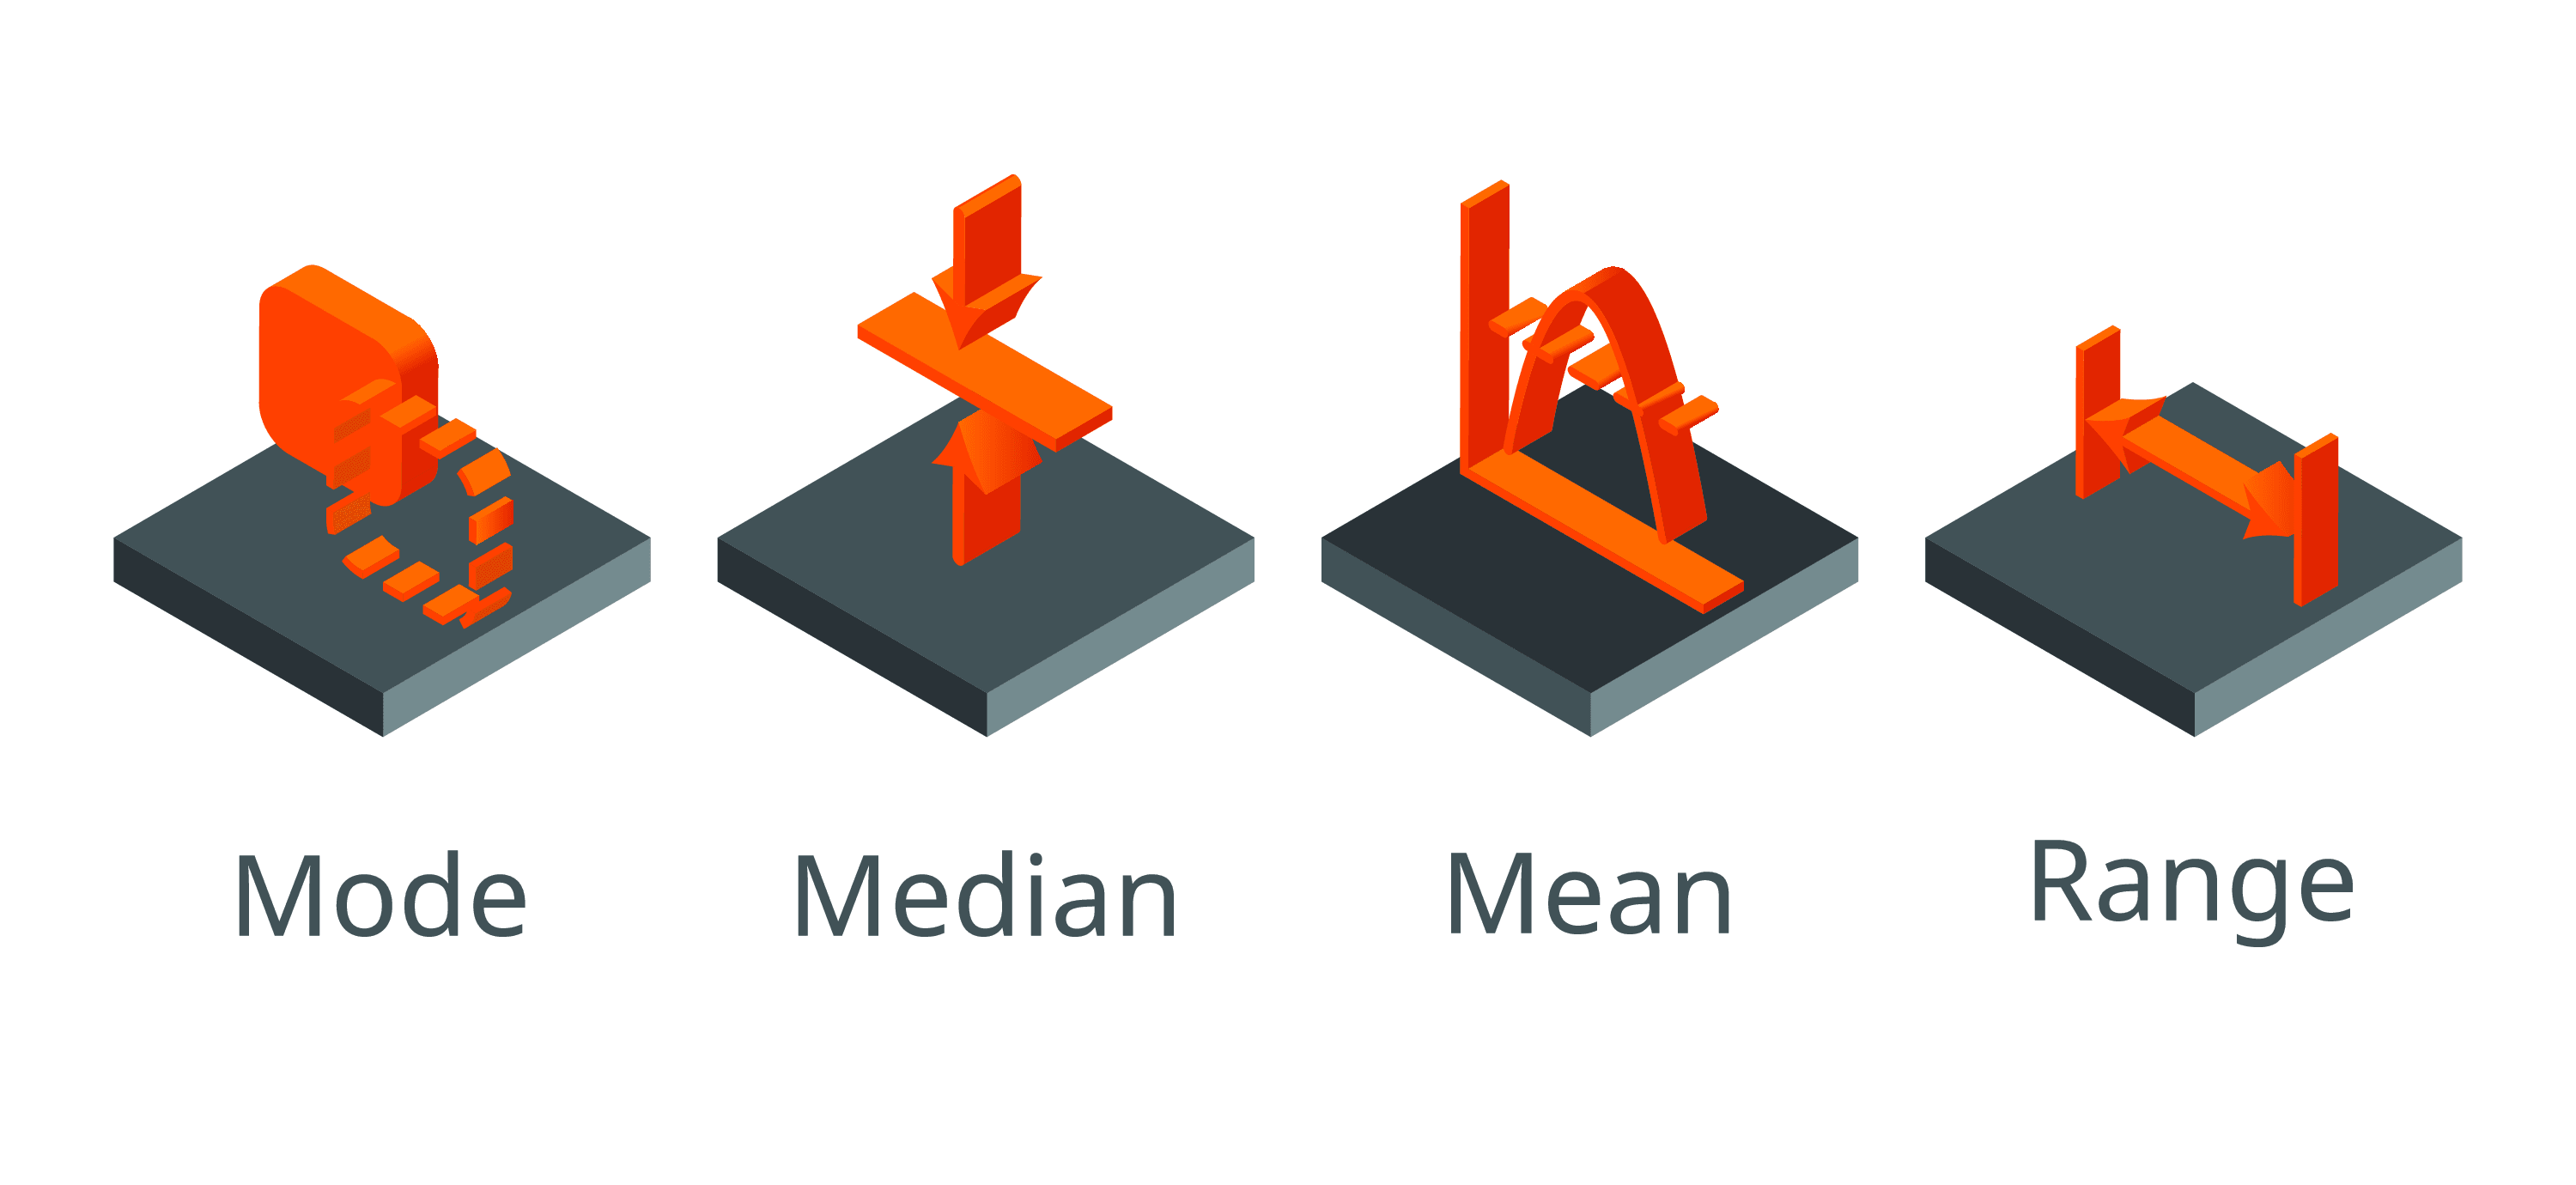
- Mean, medians, quantiles, variance, inter-quartile ranges
- Standard deviation
Includes:
- Worked examples
- Short quizzes
- Exercise(s)
Link:
http://web.med.unsw.edu.au/QMP/QMPTut2_2012/Tut2_Intro.htm [1]
[1] Rachel Thompson, Mike Bennett, Ed Loughman. QMP Medical Statistics Tutorial: Summarising data [Internet]. University of New South Wales, Faculty of Medicine; 2008 [updated 15 March 2013; cited 8 April 2013]. Available from: http://web.med.unsw.edu.au/QMP/QMPTut2_2012/Tut2_Intro.htm

No Comments on QMP Medical Statistics Tutorials: Summarising Data