How did they determine diagnostic thresholds: the stories of anemia and diabetes
Posted on 25th April 2016 by Tran Quang Hung
“There’s a story behind every person. There’s a reason why they’re the way they are.”
(Unknown)
Yes, and there’s a story behind every diagnostic threshold, too.
Thanks to these stories, we can become aware of the relevant evidence and, of course, the reasons why we should follow these thresholds.
Generally, there are 2 methods used to come up with diagnostic thresholds.
Method #1: We gather information from a large sample of healthy people, figure out what the “physiologic” values are. Then if an individual falls out of this reference range, he or she will be labeled “abnormal”.
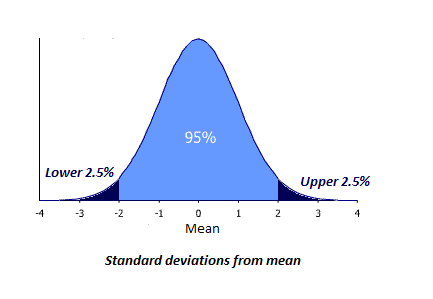
Laboratories usually use a reference range including 95% of the reference population. If results are normally distributed, this includes results within approximately two standard deviations above, and two standard deviations below, the mean value [2]. So, any value less than the 2.5th percentile and any value bigger than the 97.5th percentile is labeled “abnormal”.
But how do we know whether “abnormal” is indeed “abnormal” or not? I mean, if an atypical result isn’t associated with a higher risk of disease (or mortality), it doesn’t make any sense to consider it “abnormal”. This issue creates the foundation of Method #2: we’ll identify test results associated with increased risk of an adverse outcome. However, because the relationship between test results and the adverse outcome is usually continuous, it may be difficult to choose a cut-off point, above or below which prognosis changes.
Let’s find out how epidemiologists use these 2 methods by studying the cases of hemoglobin concentration in anemia and HbA1c in diabetes.
The story of anemia
In 1968, the World Health Organization (WHO) proposed thresholds to diagnose anemia. (Anemia is a condition in which there is a deficiency of red cells or of hemoglobin in the blood, resulting in tiredness and a pale appearance). The diagnostic thresholds the WHO proposed were based on small reference samples of nonelderly subjects [3]:
- Hemoglobin (Hb) of < 13 g/dL for adult men
- Hb < 12 g/dL for nonpregnant women
- Hb < 11 g/dL for pregnant women.
(With g/dL being a measure of the concentration of hemoglobin in the blood).
Those diagnostic thresholds have received several criticisms. Although it’s been shown that the thresholds defined by the WHO correlate with higher risk of mortality in people ≥ 85 years old [1], some authors think that evidence is still not sufficient for those thresholds to be applied.
Two large databases (NHANES-III and SCRIPPS-Kaiser Data) were collected then, to help us verify the thresholds proposed by the WHO.
If 2.5th percentile is chosen to set diagnostic points, based on the SCRIPPS-Kaiser database, the thresholds should be:
- Hb < 13.4 g/dL for men 20-59 years old
- Hb < 12.8 g/dL for men ≥ 60 years old
- Hb < 11.9 for women of all ages.
Based on the NHANES-III database, the thresholds should be:
- Hb < 13.4 g/dL for men 20-59 years old
- Hb < 12.4 g/dL for men ≥ 60 years old
- Hb < 11.9 g/dL for women 20-49 years old
- Hb < 11.6 g/dL for women ≥ 50 years old [9].
But those are only the numbers derived from cross-sectional databases (i.e. these thresholds have been chosen because – in the populations tested – only 2.5% of the population had a haemoglobin concentration which was lower than these figures). But is there any research studying the link between hemoglobin concentration and mortality?
Yes.
In 2001, Bruce and colleagues started a study on more than 17,000 community-dwelling adults ≥ 66 years old.
They found that the lowest risk for mortality occured at hemoglobin concentration values between 13-15 g/dl for women and 14-17 g/dl for men [8]. Risk of mortality increases when the hemoglobin concentration goes far from those ranges (i.e. either gets lower or higher), which constitutes a risk curve that’s similar to the Nike logo.
Image retrieved from commons.wikimedia.org
Not all relevant studies are cited here. But as we can see, different thresholds were proposed across the studies.
The thresholds have all been determined using science. They all are evidence-based. But they vary and they are numerous.
So, a good understanding of the stories behind the numbers is always necessary to choose a reasonable number, right?
Which threshold would you choose?
The story of HbA1c
In the landmark “Evaluation of Screening and Early Detection Strategies for Type 2 Diabetes and Impaired Glucose Tolerance” (DETECT-2) analysis, researchers pooled data from over 44,000 individuals across five countries. They then examined the relationship between retinopathy and three glycemic measures: fasting plasma glucose (i.e. blood sugar levels several hours after fasting), 2-hour post oral glucose load plasma glucose (i.e. blood sugar levels 2 hours after consuming glucose), and HbA1c [4]. HbA1c is a measure of an individual’s average blood glucose levels over a recent period of weeks/months and retinopathy is disease of the retina which can result in impairment or loss of vision. Retinopathy has advantages over the other diabetic complications. It’s relatively easy to identify, and it’s specific to diabetes, unlike nephropathy or neuropathy which, without sophisticated investigations, can be hard to attribute with confidence to diabetes.
The researchers found that the prevalence of retinopathy was low when HbA1c < 6.0% but it increased above this level, with an optimal threshold of 6.4%.
So, to predict microvascular complications (such as retinopathy), the diagnostic threshold of HbA1c ≥ 6.5% appears to be appropriate.
However, the threshold of 6.5% is not so good in predicting cardiovascular outcomes. The American Diabetes Association (ADA) states that individuals with a HbA1c from 5.7% to 6.4% are considered to be at “increased risk” for cardiovascular disease. Therefore, those people should be guided with effective strategies, such as weight loss and physical activity, to lower their risks. [7]
That’s maybe one reason why the WHO added this sentence in their report in 2011: “A value of less than 6.5% does not exclude diabetes diagnosed using glucose tests.” [6] (i.e. because individuals may still be at elevated risk for certain complications – like cardiovascular disease – even below the 6.5% diagnostic threshold).
To verify the use of HbA1c for diagnosing diabetes, in 2010 Zhonglu and colleagues conducted a study on 2 populations [5]. Let’s call them population A and B. All the participants in the two populations underwent an oral glucose tolerance test (which was considered the “gold standard” for diagnosing type II diabetes in this study) and a concomitant HbA1c measurement.
Based on population A, Zhonglu found that HbA1c value at the 2.5th percentile was 5.6%, and at the 97.5th percentile was 6.9%.
HbA1c ≤ 5.5% was chosen to rule out diabetes and ≥ 7.0% to rule in diabetes. Zhonglu applied those thresholds to population B.
The ruling-out threshold provided high negative predictive value: 99%. That is, 99% of participants who had a HbA1c value ≤ 5.5% did not have diabetes (as ruled out by a healthy oral glucose tolerance test score). Meanwhile, the ruling-in threshold showed 100% positive predictive value. That is, 100% participants who had a HbA1c value ≥ 7.0% did have diabetes (as diagnosed using the oral glucose tolerance test).
By lowering the ruling-in point to 6.5%, the specificity remained 99%, while positive predictive value was still near 100%. Wow! So these thresholds can be used to very accurately rule diabetes in and to rule it out.
This time, the case is not so hard, right?
It’s the end of our journey through the stories of anemia and diabetes diagnostic thresholds. Hopefully those 2 stories can help you gain a deeper insight into the way the epidemiologists came up with those cut-off figures.
It’s your turn now. Do you have any story to share? Don’t hesitate. We’d love to hear.
REFERENCES
1/ Izaks GJ, Westendorp RJ, Knook DL. The Definition of Anemia in Older Persons.JAMA. 1999;281(18):1714-1717.
2/ Phillips P. Pitfalls in interpreting laboratory results. Aust Prescr 2009;32: 43-6.
3/ World Health Organization. Nutritional anaemias: report of the WHO scientific group. Geneva: WHO; 1968.
4/ Colagiuri S, Lee CM, Wong TY, Balkau B, Shaw JE, Borch-Johnsen K. DETECT-2 Collaboration Writing Group. Glycemic thresholds for diabetes-specific retinopathy: implications for diagnostic criteria for diabetes. Diabetes Care 2011;34:145-50.
5/ Lu ZX, Walker KZ, O’Dea K, Sikaris KA, Shaw JE. A1C for screening and diagnosis of type 2 diabetes in routine clinical pratice. Diabetes Care 2010;33:817-9
6/ World Health Organization. Use of Glycated Haemoglobin (HbA1c) in the Diagnosis of Diabetes Mellitus. Abbreviated Report of a WHO Consultation. Geneva: WHO; 2011.
7/ American Diabetes Association. Diagnosis and classification of diabetes mellitus. Diabetes Care 2011;34(Suppl 1):S62-9.
8/ Culleton BF, Manns BJ, Zhang J, Tonelli M, Klarenbach S, Hemmelgarn BR. Impact of anemia on hospitalization and mortality in older adults. Blood. 2006;107(10):3841–6.
9/ Beutler E, Jill W. The definition of anemia: what is the lower limit of normal of the blood hemoglobin concentration?. Blood 2006;107(5): 1747-1750.
Read more of Tran’s blogs here…
Efficacy of drugs: 3 examples to get you to truly understand Number Needed to Treat (NNT)
Key to statistical result interpretation: P-value in plain English
Surrogate endpoints: pitfalls of easier questions
Why should medical students know about kappa value?


No Comments on How did they determine diagnostic thresholds: the stories of anemia and diabetes
What about anemia diagnosis amongst diferent races? Populations vary depending the region of the world that are located. Local studies should be made where possible, don’t you think, Quang?
25th April 2016 at 10:26 pmYou’re right, Eduardo. Maybe you’ll wanna take a look at this study. It talks about anemia threshold in India and Vietnam.
26th April 2016 at 10:18 amhttp://www.ncbi.nlm.nih.gov/pmc/articles/PMC4175707/