Average measures of effects can be misleading
Posted on 16th March 2018 by Bethan Copsey
This is the twenty-sixth blog in a series of 36 blogs based on a list of ‘Key Concepts’ developed by an Informed Health Choices project team. Each blog will explain one Key Concept that we need to understand to be able to assess treatment claims.
When the mean doesn’t show what the results really mean
The mean treatment outcome (or average) is often reported in comparing the results of different groups in a clinical trial. However, sometimes the average result can be misleading. The mean may be misleading because of uneven spread in the results or uncertainty about whether patients had an important improvement.
1. The mean does not show the spread of results
For example, if you want to look at the height of the students in a class, the average height is the same in classes A, B and C below but the heights of the individual students are very different.

This can also be the case when looking at treatment effects. It is unlikely that a treatment will affect all patients in the same way.
2. The spread of results may not be even
In the examples above on average height, the results are spread evenly above and below the average. However, this is not always the case. One person’s result can have a large effect on the average of the whole group.
For example, say you ask patients to rate their pain on a 0-100 scale and the results are:
Group A: For 99 people, pain improved by 10 points; for 1 person, pain improved by 50 points.
Group B: For 99 people, pain improved by 10 points; for 1 person, pain worsened by 50 points.
The average is a 10.4 point improvement in group A and a 9.4 improvement in group B. Based on the mean, the treatment in group A looks better but, in reality, for 99% of people, both treatments are equally effective.
In this case, the mean is misleading since two people with extreme results are pulling the average up or down, so it does not represent the population as a whole. This is what happens when there is a ‘skewed’ distribution because of extreme outliers.
In a similar way, two groups can have the same mean result, even though most participants do better on treatment A but there is just one patient who does really well on treatment B, as in the example below.
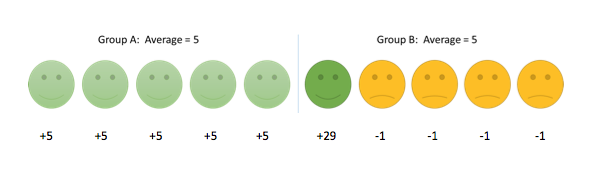
3. The mean does not show how many people had a noticeable or important improvement
Another way in which the mean can be misleading is that it does not give us information about how a patient’s improvement relates to whether they had an important or noticeable change. Sometimes this change is referred to as the minimum important difference.
From the example below, if we only look at the average, group C seemed better than group D since they improved by 5 points on average compared to 4 points in group D.
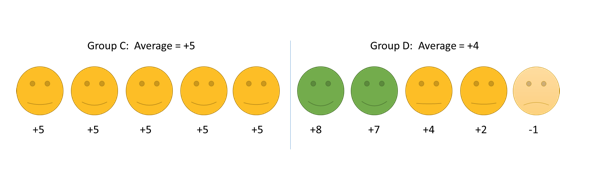
However, if a minimum 7 point change is needed to be noticeable in the patient, no patient in group C experienced a noticeable change but 2 people in group D did. In terms of the proportion of patients who have an important improvement, group D is better than group C.
The average in this example is misleading as it does not show which patients have an important change. When the average is higher in one group, it does not necessarily mean that the treatment for that group was more effective since most patients do not experience the ‘average effect’.
Round up
There are several ways in which the average result can be misleading. If the spread of results is uneven, the average can be influenced by extreme results making the treatment seem more or less effective than it really is. Moreover, the average does not give us information about which patients have a clinically meaningful improvement.
If you are looking at your own data, look at a histogram or other visual display to see how the results are spread. Look into what others describe as a meaningful change in the scale and look at how many patients achieved it.
When looking at results in research articles, you should not rely on only comparing the means of two treatment groups to decide which is better. Look out for additional information on how spread out the results are (e.g. standard deviation or range), whether the spread is even (if it is normally distributed) and what represents a meaningful change in the measurement scale (e.g. percentage who achieved the Minimum Important Difference).